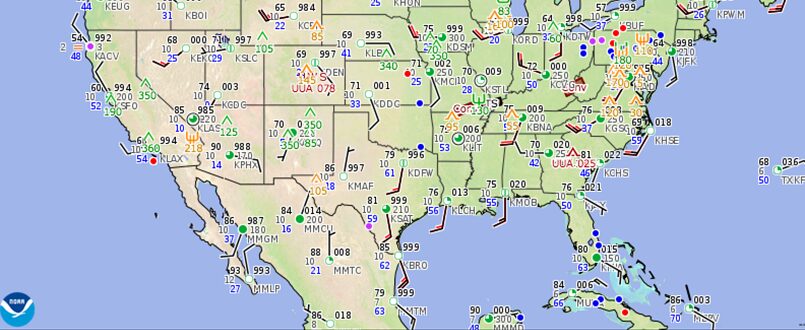
I wonder how many people skydive without looking at the weather. Not the weather you see outside the open door from the plane, it is always perfect, of course. No, I mean actual weather data – forecasts, trends, wind aloft etc. You know, these cryptic marks, signs and reports, produced by weather scientists. And I was going to explain them, but just making a screenshot killed my motivation. They say it’s weather science, and the science skydivers know is this: if you want to jump – you should stay at the drop zone to hop on the plane whenever the weather turns better. But do we know what is going on between 13000 feet and the ground? After all, being a safe skydiver does require some weather knowledge. So I am going to start with the simplest piece of knowledge : Winds Aloft
[ul class=”row-fluid”][li class=”span6″]We all saw notes around manifest, that look something like this:
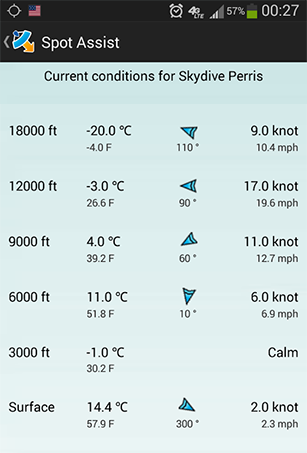
– 9000: 35 knot, direction 280
– 6000: 20 knot, direction 200
– 3000: 25 knot, direction 240[/li][li class=”span6″] [/li][/ul]Now, this is more clear, nice people at manifest just decoded the original Winds Aloft Report. Let’s see how it is decoded.
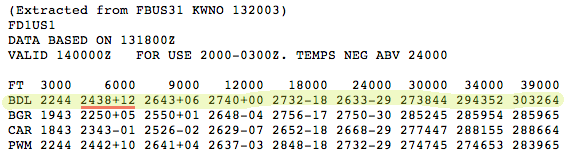
- The left column is the weather station name. A station is either an airport, or some facility that reports weather. For instance: BDL is Bradley International Airport: You can see it here http://www.airnav.com/airport/KBDL.
- Top row records reported altitudes, in feet: 3000, 6000, 9000 etc.
- And finally, the meat. 2438+12. Reported by BDL at 6000 feet. In simple terms, it means:
- First two digits: 24*10 = 240 degrees – i.e. wind is blowing from this direction. Remember, in aviation the wind always displays the direction from which it blows. Just for convenience, because it helps to pick a landing direction. The preferred landing direction is into the wind. So if the wind is blowing from 240 degrees – that becomes your preferred into the wind landing direction: 240 degrees.
- The next two digits, 38, this is the wind speed in knots. One knot is 1.15 miles per hour. So our speed is 38 knots, or 43 mph.
- And lastly +12, this is just a temperature, in C.
So, now we got decoded data at 6000 feet: 38 knots, from 240 degrees, temperature +12 C
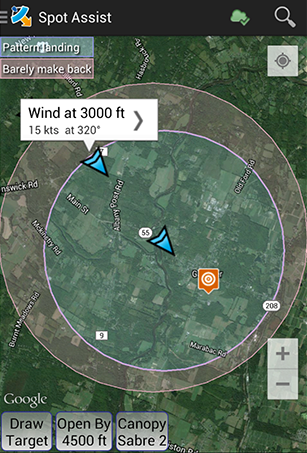
Not too hard, right? But repeat it multiple times for all altitudes, and all weather stations around your drop zone. And try to visualize the drop zone runway direction. Now match this with the decoded winds, and you get a resulting picture. Maybe also convert knots to miles per hour. You may start thinking – there must be a better way, with all the computing power in our pockets. Spot Assist presents winds aloft right on the map.
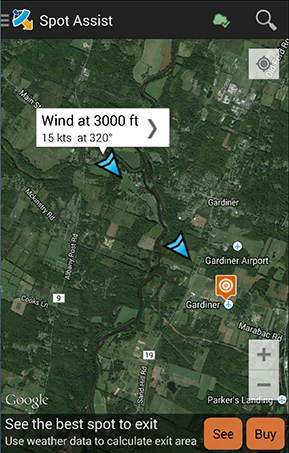
P.S. If you are asking yourself, how did we get the surface wind, or how are safe exit circles calculated, read on What Is Spot Assist and Flying Formula.
Happy jumping and Blue Skies


One Thought on “Skydiving weather. Wind Aloft”
Comments are closed.